DAMMU SWING TRADING PROScalping and swing trading tool for 15-min and 1-min charts.
Designed for trend, pullback, and reversal analysis.
Works optionally with Heikin Ashi candles.
Indicators Used
EMAs:
EMA89/EMA75 (green)
EMA200/EMA180 (blue)
EMA633/EMA540 (black)
EMA5-12 channel & EMA12-36 ribbon for short-term trends
Price Action Channel (PAC) – EMA high/low/close, length adjustable
Fractals & Pristine Fractals (BW filter)
Higher High (HH), Lower High (LH), Higher Low (HL), Lower Low (LL) detection
Pivot Points – optional, disables fractals automatically
Bar color coding based on PAC:
Blue → Close above PAC
Red → Close below PAC
Gray → Close inside PAC
Trading Signals
PAC swing alerts: arrows or shapes when price exits PAC with optional 200 EMA filter.
RSI 14 signals (if added):
≥50 → BUY
<50 → SELL
Chart Setup
Two panes: 15-min (trend anchor) + 1-min (entry)
Optional Heikin Ashi candles
Use Sweetspot Gold2 for support/resistance “00” and “0” lines
Trendlines can be drawn using HH/LL or Pivot points
Usage Notes
Trade long only if price above EMA200; short only if below EMA200
Pullback into EMA channels/ribbons signals potential continuation
Fractals or pivot points help define trend reversals
PAC + EMA36 used for strong momentum confirmation
Alerts
Up/Down PAC exit alerts configurable with big arrows or labels
RSI labels show buy/sell zones (optional)
Works on both 15-min and 1-min timeframes
If you want, I can make an even shorter “super cheat-sheet” version for 1-page quick reference for trading. It will list only inputs, signals, and colors.
Search in scripts for "Up down"

Triple EMA & alertsTriple EMA & Alerts
This indicator plots three customizable Exponential Moving Averages (EMAs) (default: 50, 100, 200) and highlights key trend structure changes and crossovers between them.
Features
Adjustable EMA lengths, colors, and line widths.
Optional higher-timeframe calculation (select timeframe or leave blank for current).
Visual markers for all crossover events:
Triangle Up/Down for EMA1–EMA2, EMA2–EMA3, and EMA1–EMA3 crosses.
Circle markers for full bullish/bearish alignment (EMA1 > EMA2 > EMA3 or EMA1 < EMA2 < EMA3).
Built-in alert conditions for each crossover and structure change, allowing automated signals or notifications.
Use
Identify short-term momentum shifts with EMA1/EMA2 crosses.
Track long-term trend reversals with EMA1/EMA3 crosses.
Confirm strong trend alignment when all EMAs are ordered (bullish or bearish).

Khusan Pullback & Mean-Reversion (Manual ADX, Clean)Description
The indicator combines two logics in one tool:
Trend Pullback: Entries in the direction of the dominant trend after a short-term pullback to the EMA.
Return to the mean (Mean-Reversal): countertrend trades from external Bollinger bands with an RSI filter.
Key Features
Manual ADX (Wilder calculation): more precisely, it controls the strength of the trend without hidden smoothing.
There is a clear separation of market modes: the background of the chart highlights the condition: trend up/down or sideways (range).
Signal tags: Long TPB / Short TPB for pullbacks in the trend, Long MR / Short MR for a return to the average.
A minimum of “noise": neat colors, clear captions, without unnecessary graphics.
How to read signals
Trend Pullback
Long TPB — ADX ≥ threshold, price returns above fast EMA, RSI > 45.
Short TPB — ADX ≥ threshold, price goes below fast EMA, RSI < 55.
Mean-Reversion
Long MR — sideways (ADX < threshold), price below lower BB, RSI < 30, confirmation of reversal.
Short MR — sideways (ADX < threshold), price above upper BB, RSI > 70, reversal confirmation.
Parameters (Inputs)
EMA fast / EMA slow — fast and slow EMA (default 20/50).
ADX length / threshold — period and trend strength threshold.
BB length / mult — period and Bollinger Bands multiplier.
RSI length — RSI period.
Show labels/background — enable mode signatures and highlighting.
Recommendations for use
Timeframes: from M15 to H4. On lower TF, add a filter by the higher trend (e.g. H1/H4 EMA).
Instruments: XAUUSD, FX majors, indices, liquid futures and crypto pairs.
Risk management: for TPB, use SL behind the local swing extremum/below the EMA zone; for MR, use SL behind the external BB.
Filters: avoid entering against strong news; prioritize MR when volatility is low, and TPB when volatility is high.
Alerts
Create standard alerts based on the appearance of Long/Short TPB and Long/Short MR labels — the indicator provides clear conditions for auto-entry/notifications.
Important
The indicator is not

ORDER FLOW Professional & Delta LineThe ORDER FLOW Professional & Delta Line indicator provides a powerful visualization of buy and sell volume imbalances within each candle — offering traders a deeper view into market order flow dynamics.
Inspired by footprint charts, this tool estimates Up Volume, Down Volume, and their difference (Delta) to highlight whether buyers or sellers are in control. It’s designed for traders who want a clear and professional way to track volume-based momentum directly on their charts.
🔹 Key Features:
Accurate estimation of buy (Up) and sell (Down) volume per bar
Delta Line displaying the net order flow difference
Customizable delta color for personalized visualization
Optional numeric labels showing Up, Down, and Δ values
Footprint-style column display in a clean lower panel
Background color shading to reflect positive/negative delta
💡 Ideal For:
Professional traders and volume analysts seeking to confirm price action through order flow insights, detect absorption or exhaustion, and enhance decision-making with visual delta tracking.

SFC Bollinger Band and Bandit概述 (Overview)
SFC 布林通道與海盜策略 (SFC Bollinger Band and Bandit Strategy) 是一個基於 Pine Script™ v6 的技術分析指標,結合布林通道 (Bollinger Bands)、移動平均線 (Moving Averages) 以及布林海盜 (Bollinger Bandit) 交易策略,旨在為交易者提供多時間框架的趨勢分析與進出場訊號。該腳本支援風險管理功能,並提供視覺化圖表與交易訊號提示,適用於多種金融市場。
This script, written in Pine Script™ v6, combines Bollinger Bands, Moving Averages, and the Bollinger Bandit strategy to provide traders with multi-timeframe trend analysis and entry/exit signals. It includes risk management features and visualizes data through charts and trading signals, suitable for various financial markets.
功能特點 (Key Features)
布林通道 (Bollinger Bands)
提供可調整的標準差參數 (σ1, σ2),支援多層布林通道顯示。
進場訊號基於價格穿越布林通道上下軌,並結合連續K線確認機制。
Provides adjustable standard deviation parameters (σ1, σ2) for multi-layer Bollinger Bands display.
Entry signals are based on price crossing the upper/lower bands, combined with a consecutive bar confirmation mechanism.
移動平均線 (Moving Averages)
支援簡單移動平均線 (SMA) 或指數移動平均線 (EMA),可自訂快、中、慢線週期。
Supports Simple Moving Average (SMA) or Exponential Moving Average (EMA) with customizable fast, medium, and slow line periods.
布林海盜策略 (Bollinger Bandit Strategy)
基於變動率 (ROC) 與布林通道動態止損,提供做多與做空訊號。
包含動態止損均線與平倉天數設定,增強交易靈活性。
Utilizes Rate of Change (ROC) and Bollinger Bands with dynamic stop-loss for long and short signals.
Includes dynamic stop-loss moving average and liquidation days for enhanced trading flexibility.
多時間框架分析 (Multi-Timeframe Analysis)
支援六個時間框架 (5分、15分、1小時、4小時、日線、週線) 的趨勢分析。
通過表格顯示各時間框架的連續上漲/下跌趨勢,輔助交易決策。
Supports trend analysis across six timeframes (5m, 15m, 1h, 4h, daily, weekly).
Displays consecutive up/down trends in a table to aid decision-making.
風險管理 (Risk Management)
提供基於 ATR 或布林通道的停利/停損設定。
自動計算交易手數,根據報價貨幣匯率調整風險敞口。
Offers take-profit/stop-loss settings based on ATR or Bollinger Bands.
Automatically calculates trading lots, adjusting risk exposure based on quote currency exchange rates.
視覺化與提示 (Visualization and Alerts)
繪製布林通道、移動平均線、海盜策略動態止損線及交易訊號。
提供多時間框架趨勢表格、交易手數標籤及浮水印。
支援交易訊號快訊,方便即時監控。
Plots Bollinger Bands, Moving Averages, Bandit strategy stop-loss lines, and trading signals.
Includes multi-timeframe trend tables, trading lot labels, and watermark.
Supports alert conditions for real-time trade monitoring.
使用說明 (Usage Instructions)
設置參數 (Parameter Setup)
布林通道 (Bollinger Bands): 可調整週期 (預設21)、標準差 (σ1=1, σ2=2) 及停利/停損依據 (ATR 或 BAND)。
移動平均線 (Moving Averages): 可選擇顯示快線 (10)、中線 (20)、慢線 (60),並切換 SMA/EMA。
布林海盜 (Bollinger Bandit): 調整通道週期 (50)、平倉均線週期 (50) 及 ROC 週期 (30)。
時間框架 (Timeframes): 自訂六個時間框架,預設為 5分、15分、1小時、4小時、日線、週線。
Adjust Bollinger Band period (default 21), standard deviations (σ1=1, σ2=2), and take-profit/stop-loss basis (ATR or BAND).
Configure Moving Averages (fast=10, medium=20, slow=60) and toggle SMA/EMA.
Set Bollinger Bandit parameters: channel period (50), liquidation MA period (50), ROC period (30).
Customize six timeframes (default: 5m, 15m, 1h, 4h, daily, weekly).
交易訊號 (Trading Signals)
買入訊號 (Buy): 價格穿越下軌且滿足連續K線條件。
賣出訊號 (Sell): 價格穿越上軌且滿足連續K線條件。
海盜策略訊號: 基於 ROC 與布林通道穿越,結合動態止損。
Buy signal: Price crosses below lower band with consecutive bar confirmation.
Sell signal: Price crosses above upper band with consecutive bar confirmation.
Bandit strategy signals: Based on ROC and band crossings with dynamic stop-loss.
視覺化 (Visualization)
布林通道以不同顏色顯示上下軌與中軌。
移動平均線以快、中、慢線區分顏色。
趨勢表格顯示各時間框架的趨勢狀態 (🔴上漲, 🟢下跌, ⚪中性)。
海盜策略顯示動態止損線與交易狀態。
Bollinger Bands display upper, lower, and middle bands in distinct colors.
Moving Averages use different colors for fast, medium, and slow lines.
Trend table shows timeframe trends (🔴 up, 🟢 down, ⚪ neutral).
Bandit strategy displays dynamic stop-loss and trading status.

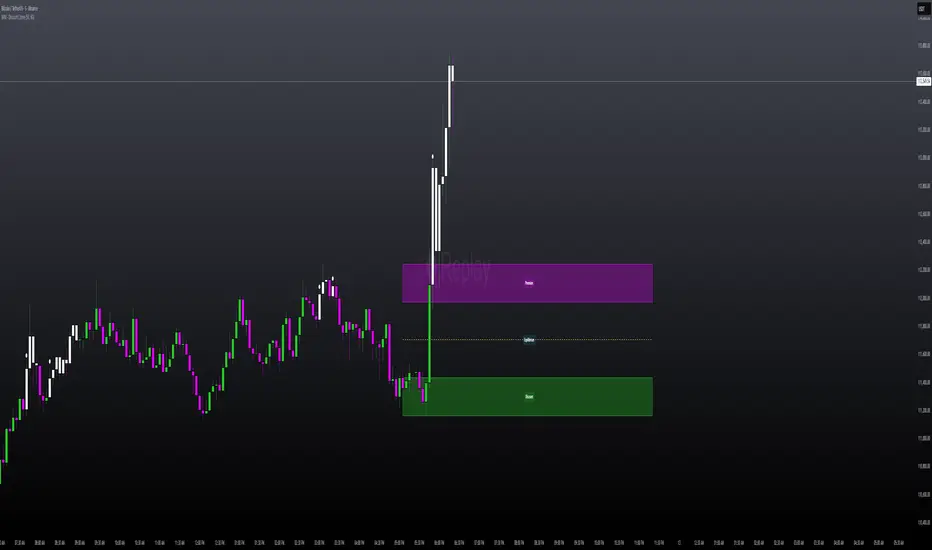
MILLION MEN - Discount Zone BreakoutsWhat it is
MILLION MEN — Discount Zone Breakouts (Lite & Stable) highlights a structure-based trading range from the latest confirmed swing high/low, renders Premium/Equilibrium/Discount zones, and raises one-shot breakout signals when price closes outside the range. It focuses on stable visuals and simple breakout logic suitable for intraday and swing trading.
How it works (high-level)
Confirmed swings: Uses ta.pivothigh/ta.pivotlow with auto or manual pivot length.
Range & zones: From the swing range, the tool derives Premium (top 25%), Equilibrium (50%), and Discount (bottom 25%).
Anchoring: Left edge is locked at the bar where the pivot confirms; the right edge can extend N bars.
One-shot breakouts:
Up breakout: first close > swingHigh (resets on new range).
Down breakout: first close < swingLow (resets on new range).
Optional on-close only mode to avoid intrabar noise.
Clean UI: Optional zone boxes, dashed equilibrium line, mid-labels (“Premium / Equilibrium / Discount”), and minimal candle coloring by regime.
How to use
Treat Discount as value area in bullish contexts and Premium as distribution area in bearish contexts.
Breakout dots (up/down) mark regime shifts beyond the current range; confirm with your higher-TF bias, volume, or momentum.
Tune pivot length and forward extension to your timeframe (e.g., smaller for scalping, larger for swings).
Originality & value
Unlike generic S/R overlays, this lite tool prioritizes confirmed swing structure with a fixed anchor, clear 25/50/75 zone mapping, and one-shot breakout logic to prevent repetitive signals until a new range forms. The emphasis is on stability + readability, making it a dependable building block in multi-indicator workflows.
Limitations & transparency
Breakouts on strong trends can retest or fail; always add confirmation (structure/volume).
Pivots confirm with delay equal to pivot length—this reduces repaint and is intentional.
Non-standard bar types are not supported for signal logic.
This indicator provides analysis, not financial advice.
Arabic
يعرض السكربت آخر مدى مؤكد من قمّة/قاع ويرسم مناطق Premium / Equilibrium / Discount، ويعطي إشارة اختراق لمرة واحدة عند إغلاق السعر فوق القمّة أو تحت القاع. الفكرة بسيطة وثابتة بصريًا، وتصلح للإنترادي والسوينغ. يُفضّل تأكيد الاختراق بهيكل أعلى إطار أو فوليوم/مومنتُم. تذكير: تأكيد القمم/القيعان متأخر بحسب طول البيفوت لتفادي إعادة الرسم.
Custom Weekly WED→TUEPurpose:
This indicator creates custom weekly candles with a week boundary running from Wednesday to Tuesday (WED→TUE) for any symbol. It is designed for systems that prefer to close the trading week on Tuesday’s session instead of the standard weekend.
Custom Candle Logic (WED→TUE):
• Open = Opening price on Wednesday (start of the custom week).
• Close = Closing price on Tuesday (end of the custom week).
• High/Low = Maximum/minimum during the entire range from Wednesday → Tuesday.
Display Behavior:
• Only renders when the chart timeframe = 1W (Weekly).
• Completed weeks (with full Wed→Tue data) are shown as candlesticks (colored up/down based on O/C).
• The current incomplete week is shown as a preview box shifted to the next weekly slot (the column to the right), allowing you to see the progress of the ongoing week while keeping the last completed week intact.
Inputs:
• Start day (1=Mon…7=Sun) — default is 3 = Wednesday. You can change this to redefine the week boundary.
• Show current (incomplete) custom week — toggles the preview box for the current running week.
• Up/Down/Doji color — defines the colors of completed weekly candles.
• Preview box transparency — controls the opacity of the preview box for the ongoing week.

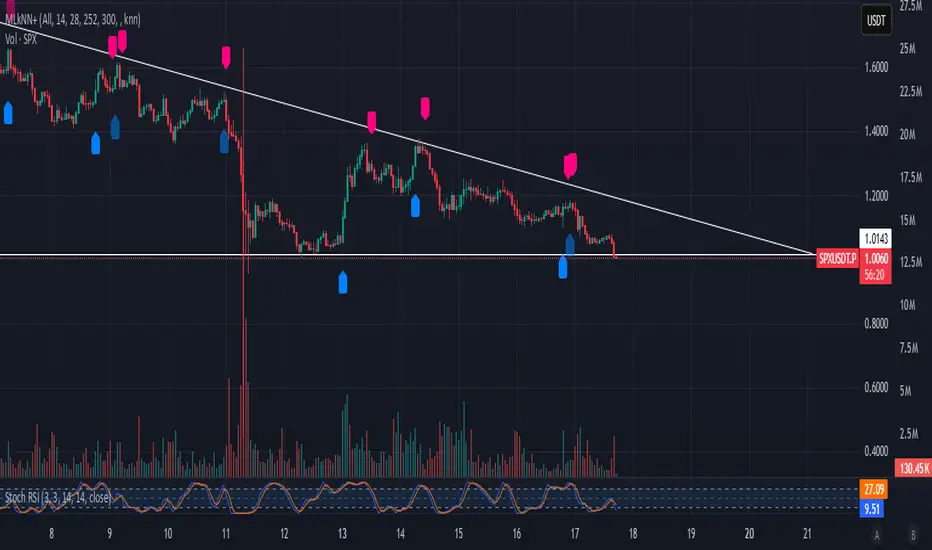
GR ML kNN-based Strategy A machine-learning-driven trading strategy built around the k-Nearest Neighbors (kNN) algorithm — designed, tuned, and tested by GR.
This system studies recent price behavior and indicator patterns to predict the probability of the next move (up, down, or neutral) and only trades when multiple confirmations align. It combines data-driven signals with strict market-structure filters for maximum precision.
EM Range (VIX1D PrevClose • Close & Hi/Lo, N-Day View)What this indicator does
This study projects a one-day expected move (EM) from the CBOE:VIX1D using a simple 1-σ model with 252 trading days. It visualizes the possible intraday range from three anchors and also gives a T+1 forecast using today’s real-time VIX1D:
• PrevClose ±σ (solid) – a symmetric bracket around yesterday’s close.
• Low → Upper (dashed) – the upper bound implied from today’s low.
• High → Lower (dashed) – the lower bound implied from today’s high.
• NextDay (solid, optional) – tomorrow’s expected bracket built from the current price using today’s VIX1D (intraday it updates; after the daily close it freezes to the daily close).
All ranges are plotted in points, not percentages.
How it’s computed
Let σ = (VIX1D/100)/sqrt(252) * multiplier.
• PrevClose bands: prevClose * (1 ± σ) using yesterday’s VIX1D close.
• Low → Upper: todayLow * (1 + σ) using yesterday’s VIX1D close.
• High → Lower: todayHigh * (1 − σ) using yesterday’s VIX1D close.
• NextDay (T+1): currentPrice * (1 ± σ_today) where σ_today uses today’s VIX1D (real-time via 15m/30m/60m fallbacks; after session close it uses the daily close).
What you’ll see on the chart
• Two solid lines (PrevClose ±σ), two dashed lines (from Low/High).
• Optional blue solid lines for NextDay ±σ (toggle).
• Lines are per-day segments (not infinite). Yesterday’s dashed lines are carried into today for quick context; other lines do not carry across days.
• Colors are fully configurable; defaults use a deep, high-contrast palette tuned for dark backgrounds.
N-Day history (no over-extension)
Use “Show last N days” to display previous sessions. Historical lines are drawn only within their own day (clean separation of regimes).
Compact table (top-right by default)
The on-chart table shows concise, single-line rows:
• VIX1D−1: yesterday’s VIX1D close | ±EM (points) from PrevClose
• VIX1D (RT): today’s real-time VIX1D | ±EM (points) from current price
• Prev ±σ: numeric around PrevClose
• L → Upper: today’s low and its implied upper bound
• H → Lower: today’s high and its implied lower bound
• NextDay: tomorrow’s implied from current price
• >±σ: count of daily closes that finished outside PrevClose ±σ over the last N−1 completed days (with up/down breakdown)
Inputs & options
• VIX1D symbol: default CBOE:VIX1D.
• σ multiplier: default 1.0 (try 0.5 / 1.5 / 2.0 based on your risk model).
• Show last N days: how many sessions to render (incl. today).
• Show NextDay lines (blue): on/off toggle.
• Line width and color pickers for each band type.
• Table position: top/bottom, left/right.
Works on…
• Any instrument priced in points (stocks, ETFs, futures incl. ES).
• Any timeframe. For the T+1 forecast, the price anchor is real-time on intraday charts; on higher timeframes it uses an intraday proxy (60-minute) intraday and switches to the daily close after session end.
Notes & good practice
• VIX1D is an implied daily move proxy; it’s not a guarantee. Treat bands as probabilistic, not absolute barriers.
• The outside-±σ close count is a quick sanity check on how often price exceeds the one-day expectation—useful for regime awareness and sizing.
• If your market isn’t well-described by VIX1D (e.g., non-US hours or crypto), consider substituting a more relevant vol index.
Disclaimer: This tool is for research/education only and is not financial advice. Always manage risk.

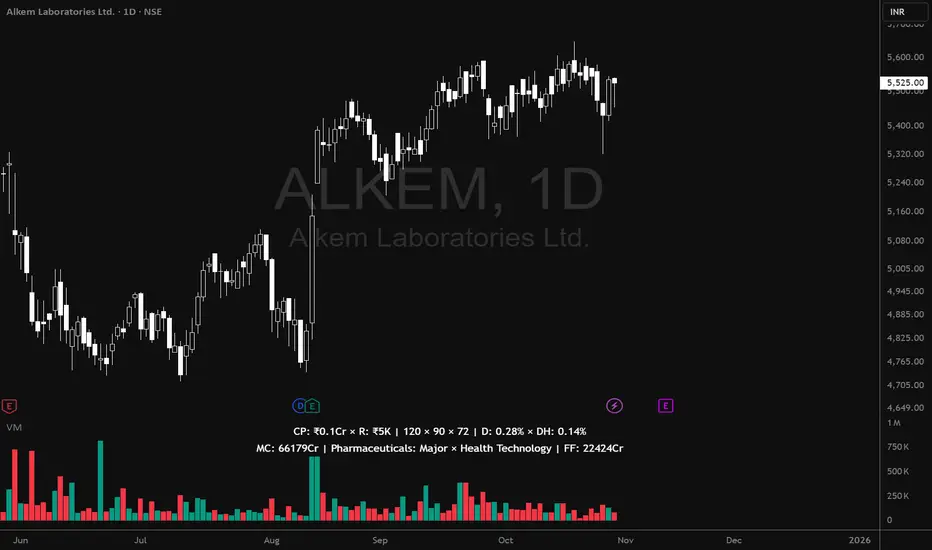
Volume MatrixVolume Matrix (VM) is a comprehensive volume and position-sizing toolkit designed to help traders interpret market participation and manage trade risk efficiently.
It combines volume analytics, risk-adjusted position sizing, and stock-specific financial data — all in a clear, visual, and automated format directly on TradingView charts.
The indicator integrates capital management, episodic volume spikes, and market capitalization data into a single, intuitive framework, giving traders an edge in both decision-making and discipline.
⚙️ Core Components & Features
🧩 1. Position Sizing & Risk Management
A dynamic risk table helps traders determine how much to trade and how much to risk per position, adapting automatically based on user inputs:
- Capital (CP): Total account size (₹ or $).
- Risk Mode (R): Choose between Percentage of capital or fixed Currency value.
- Lot Size Mode: Optional toggle to align quantities with F&O lot sizes (India-based).
- Standard Stop-Loss (SSL): Displays position quantities for three custom stop-loss levels (e.g., 0.75%, 1%, 1.25%).
- % Distance Metrics: D: Distance from day’s low/high (helps assess stop distance). DH: Distance from mid-body (useful for candle risk assessment). Auto-adjusts based on whether the trader is in Long, Short, or Both mode.
📈 Helps answer:
“How much quantity should I trade at my desired risk level?”
🔶 2. Volume Visualization
- Plots volume bars with default up/down coloring.
- Green for bullish bars.
- Red for bearish bars.
- Designed for quick visual differentiation of buying/selling pressure.
🚀 3. Episodic Pivot (EP) Detector
Identifies high-volume breakout or capitulation days, often marking significant turning points or trend initiations.
- Highlights bars where volume exceeds a custom threshold (in millions).
- Marks them visually with an orange triangle under the candle.
-Best used on daily charts to spot institutional footprints.
📊 Helps answer:
“Is today’s volume large enough to signal major institutional activity?”
🧾 4. Data Metrics Table
Displays fundamental and contextual data about the asset:
- Market Capitalization (MC): Auto-calculated using outstanding shares × price.
- Free Float (FF): Value of tradable shares in currency or Cr (INR).
- Industry × Sector × F&O Status: Shows the company’s industry and sector classification. Displays FC (Futures Contract) or NFC (Non-F&O stock).
- Customizable appearance: Choose between text/value display, text color, and background color. Flexible positioning and size control to suit any chart layout.
📚 Helps answer:
“What type of stock is this, how big is it, and does it trade in futures?”
🪄 5. User Interface Customization
- Modular UI grouped by functionality (Risk, Direction, Metrics, Volume, etc.).
- Flexible table position & size (Top/Bottom/Middle & Tiny–Huge).
- All elements are toggleable, giving full control over displayed data.
- Built to ensure visual clarity on any chart background.
| Trading Goal | How Volume Matrix Supports It |
| ------------------------------ | -------------------------------------------------------------- |
| **Risk Management** | Calculates optimal trade size and risk exposure automatically. |
| **Position Sizing Discipline** | Enforces consistent sizing across trades using SSL levels. |
| **Volume Confirmation** | Highlights institutional participation via Episodic Pivots. |
| **Stock Context Awareness** | Shows market cap, sector, and float value instantly. |
| **Efficiency** | Reduces manual work — no need for calculators or spreadsheets. |
💡 In Short
Volume Matrix simplifies trade planning, brings transparency to risk, and connects volume with context — all in one elegant visual tool.
Perfect for:
- Discretionary traders refining entries and sizing.
- Swing traders watching for volume-based pivots.
- Analysts who want price-volume fundamentals at a glance.
RSI VWAP v1 [JopAlgo]RSI VWAP v1.1 made stronger by volume-aware!
We know there's nothing new and the original RSI already does an excellent job. We're just working on small, practical improvements – here's our take: The same basic idea, clearer display, and a single, specially developed rolling line: a VWAP of the RSI that incorporates volume (participation) into the calculation.
Do you prefer the pure classic?
You can still use Wilder or Cutler engines –
but the star here is the VW-RSI + rolling line.
This RSI also offers the possibility of illustrating a possible
POC (Point of Control - or the HAL or VAL) level.
However, the indicator does NOT plot any of these levels itself.
We have included an illustration in the chart for this!
We hope this version makes your decision-making easier.
What you’ll see
The RSI line with a 50 midline and optional bands: either static 70/30 or adaptive μ±k·σ of the Rolling Line.
One smoothing concept only: the Rolling Line (light blue) = VWAP of RSI.
Shadow shading between RSI and the Rolling Line (green when RSI > line, red when RSI < line).
A lighter tint only on the parts of that shadow that sit above the upper band or below the lower band (quick overbought/oversold context).
Simple divergence lines drawn from RSI pivots (green for regular bullish, red for regular bearish). No labels, no buy/sell text—kept deliberately clean.
What’s new, and why it helps
VW-RSI engine (default):
RSI can be computed from volume-weighted up/down moves, so momentum reflects how much traded when price moved—not just the direction.
Rolling Line (VWAP of RSI) with pure VWAP adaptation:
Low volume: blends toward a faster VWAP so early, thin starts aren’t missed.
Volume spikes: blends toward a slower VWAP so a single heavy bar doesn’t whip the curve.
You can reveal the Base Rolling (pre-adaptation) line to see exactly how much adaptation is happening.
Adaptive bands (optional):
Instead of fixed 70/30, use mean ± k·stdev of the Rolling Line over a lookback. Levels breathe with the market—useful in strong trends where static bounds stay pinned.
Minimal, readable panel:
One smoothing, one story. The shadow tells you who’s in control; the lighter highlight shows stretch beyond your lines.
How to read it (fast)
Bias: RSI above 50 (and a rising Rolling Line) → bullish bias; below 50 → bearish bias.
Trigger: RSI crossing the Rolling Line with the bias (e.g., above 50 and crossing up).
Stretch: Near/above the upper band, avoid chasing; near/below the lower band, avoid panic—prefer a cross back through the line.
Divergence lines: Use as context, not as standalone signals. They often help you wait for the next cross or avoid late entries into exhaustion.
Settings that actually matter
RSI Engine: VW-RSI (default), Wilder, or Cutler.
Rolling Line Length: the VWAP length on RSI (higher = calmer, lower = earlier).
Adaptive behavior (pure VWAP):
Speed-up on Low Volume → blends toward fast VWAP (factor of your length).
Dampen Spikes (volume z-score) → blends toward slow VWAP.
Fast/Slow Factors → how far those fast/slow variants sit from the base length.
Bands: choose Static 70/30 or Adaptive μ±k·σ (set the lookback and k).
Visuals: show/hide Base Rolling (ref), main shadow, and highlight beyond bands.
Signal gating: optional “ignore first bars” per day/session if you dislike open noise.
Starter presets
Scalp (1–5m): RSI 9–12, Rolling 12–18, FastFactor ~0.5, SlowFactor ~2.0, Adaptive on.
Intraday (15m–1H): RSI 10–14, Rolling 18–26, Bands k = 1.0–1.4.
Swing (4H–1D): RSI 14–20, Rolling 26–40, Bands k = 1.2–1.8, Adaptive on.
Where it shines (and limits)
Best: liquid markets where volume structure matters (majors, indices, large caps).
Works elsewhere: even with imperfect volume, the shadow + bands remain useful.
Limits: very thin/illiquid assets reduce the benefit of volume-weighting—lengthen settings if needed.
Attribution & License
Based on the concept and baseline implementation of the “Relative Strength Index” by TradingView (Pine v6 built-in).
Released as Open-source (MPL-2.0). Please keep the license header and attribution intact.
Disclaimer
For educational purposes only; not financial advice. Markets carry risk. Test first, use clear levels, and manage risk. This project is independent and not affiliated with or endorsed by TradingView.

Candle Body Break (M/W/D/4H/1H)v5# Candle Body Break (M/W/D/4H/1H) Multi-Timeframe Indicator
This indicator identifies and plots **Candle Body Breaks** across five key timeframes: Monthly (M), Weekly (W), Daily (D), 4-Hour (4H), and 1-Hour (1H).
## Core Logic: Candle Body Break
The core concept is a break in the swing high/low defined by the body of the previous counter-trend candle(s). It focuses purely on **closing price breaks** of remembered highs/lows established by full candle bodies (close > open or close < open).
1. **Remembering the Swing:**
* After a bullish break (upward trend), the indicator waits for the first **bearish (close < open) candle** to appear. This bearish candle's high (`rememberedHigh`) and low (`rememberedLow`) are saved as the **breakout level**.
* Subsequent bearish candles that make a new low update this saved level, continuously adjusting the level to the most significant recent resistance/support established by the body's range.
2. **Executing the Break:**
* **Bull Break (Long signal):** Occurs when a **bullish candle's closing price** exceeds the last remembered bearish high (`rememberedHigh`).
* **Bear Break (Short signal):** Occurs when a **bearish candle's closing price** falls below the last remembered bullish low (`rememberedLow_Bull`).
Once a break occurs, the memory is cleared, and the indicator waits for the next counter-trend candle to establish a new level.
## Features
* **Multi-Timeframe Analysis:** Displays break lines and labels for M, W, D, 4H, and 1H timeframes on any chart.
* **Timeframe Filtering:** Break lines are only shown for timeframes **equal to or higher** than the current chart timeframe (e.g., on a 4H chart, only 4H, D, W, and M breaks are displayed).
* **Candidate Lines (Dotted Green):** Plots the current potential breakout level (the remembered high/low) that must be broken to trigger the next signal.
* **Direction Table:** A table in the top right corner summarizes the latest break direction (⇧ Up / ⇩ Down) for all five timeframes. This can be optionally limited to the 4H chart only.
* **1H Alert:** Triggers an alert when a 1-Hour break is detected.
## Input Settings Translation (for Mod Compliance)
| English Input Text | Original Japanese Text |
| :--- | :--- |
| **Show Monthly Break Lines** | 月足ブレイクを描画する |
| **Show Weekly Break Lines** | 週足ブレイクを描画する |
| **Show Daily Break Lines** | 日足ブレイクを描画する |
| **Show 4-Hour Break Lines** | 4時間足ブレイクを描画する |
| **Show 1-Hour Break Lines** | 1時間足ブレイクを描画する |
| **Show Monthly Candidate Lines** | 月足ブレイク候補ラインを描画する |
| **Show Weekly Candidate Lines** | 週足ブレイク候補ラインを描画する |
| **Show Daily Candidate Lines** | 日足ブレイク候補ラインを描画する |
| **Show 4-Hour Candidate Lines** | 4時間足ブレイク候補ラインを描画する |
| **Show 1-Hour Candidate Lines** | 1時間足ブレイク候補ラインを描画する |
| **Show Only Current TF Candidate Lines** | チャート時間足の候補ラインのみ表示 |
| **Show Table Only on 4H Chart** | テーブルを4Hチャートのみ表示 |
*Please note: The default alert message "1-Hour Break Detected" is also in English.*
※日本語訳
ろうそく足実体ブレイク(M/W/D/4H/1H)マルチタイムフレーム・インジケーター(日本語訳)
このインジケーターは、月足(M)、週足(W)、日足(D)、4時間足(4H)、1時間足(1H)の5つの主要な時間足におけるろうそく足実体ブレイクを検出し、プロットします。
コアロジック:ろうそく足実体ブレイク
このロジックの中核は、直近の**逆行ろうそく足(カウンター・トレンド・キャンドル)**の実体によって定義されたスイングの高値/安値のブレイクです。終値が実体のレンジ外で確定することを純粋に追跡します。
スイングの記憶(Remembering the Swing):
強気のブレイク(上昇トレンド)の後、インジケーターは最初に現れる弱気(終値<始値)のろうそく足を待ちます。この弱気ろうそく足の高値(rememberedHigh)と安値(rememberedLow)が、ブレイクアウトレベルとして保存されます。
その後、安値を更新する弱気ろうそく足が続いた場合、この保存されたレベルが更新され、実体のレンジによって確立された最新の重要なレジスタンス/サポートにレベルが継続的に調整されます。
ブレイクの実行(Executing the Break):
ブルブレイク(買いシグナル): 最後に記憶された弱気ろうそく足の高値(rememberedHigh)を、強気ろうそく足の終値が上回ったときに発生します。
ベアブレイク(売りシグナル): 最後に記憶された強気ろうそく足の安値(rememberedLow_Bull)を、弱気ろうそく足の終値が下回ったときに発生します。
一度ブレイクが発生すると、記憶されたレベルはクリアされ、インジケーターは次の逆行ろうそく足が出現し、新しいレベルを確立するのを待ちます。
機能
マルチタイムフレーム分析: 現在のチャートの時間足に関わらず、M、W、D、4H、1Hのブレイクラインとラベルを表示します。
時間足フィルタリング: ブレイクラインは、現在のチャート時間足と同じか、それよりも上位の時間足のもののみが表示されます(例:4時間足チャートでは、4H、D、W、Mのブレイクのみが表示されます)。
候補ライン(緑の点線): 次のシグナルをトリガーするためにブレイクされる必要がある、現在の潜在的なブレイクアウトレベル(記憶された高値/安値)をプロットします。
方向テーブル: 右上隅のテーブルに、5つの全時間足の最新のブレイク方向(⇧ 上昇 / ⇩ 下降)をまとめて表示します。これは、オプションで4時間足チャートのみに表示するように制限できます。
1時間足アラート: 1時間足のブレイクが検出されたときにアラートをトリガーします。
入力設定の翻訳
コード内の入力設定(UIテキスト)の日本語訳は以下の通りです。
英語の入力テキスト 日本語訳
Show Monthly Break Lines 月足ブレイクを描画する
Show Weekly Break Lines 週足ブレイクを描画する
Show Daily Break Lines 日足ブレイクを描画する
Show 4-Hour Break Lines 4時間足ブレイクを描画する
Show 1-Hour Break Lines 1時間足ブレイクを描画する
Show Monthly Candidate Lines 月足ブレイク候補ラインを描画する
Show Weekly Candidate Lines 週足ブレイク候補ラインを描画する
Show Daily Candidate Lines 日足ブレイク候補ラインを描画する
Show 4-Hour Candidate Lines 4時間足ブレイク候補ラインを描画する
Show 1-Hour Candidate Lines 1時間足ブレイク候補ラインを描画する
Show Only Current TF Candidate Lines チャート時間足の候補ラインのみ表示
Show Table Only on 4H Chart テーブルを4Hチャートのみ表示
Alert Message: 1-Hour Break Detected アラートメッセージ: 1時間足ブレイク発生

Luxy Momentum, Trend, Bias and Breakout Indicators V7
TABLE OF CONTENTS
This is Version 7 (V7) - the latest and most optimized release. If you are using any older versions (V6, V5, V4, V3, etc.), it is highly recommended to replace them with V7.
Why This Indicator is Different
Who Should Use This
Core Components Overview
The UT Bot Trading System
Understanding the Market Bias Table
Candlestick Pattern Recognition
Visual Tools and Features
How to Use the Indicator
Performance and Optimization
FAQ
---
### CREDITS & ATTRIBUTION
This indicator implements proven trading concepts using entirely original code developed specifically for this project.
### CONCEPTUAL FOUNDATIONS
• UT Bot ATR Trailing System
- Original concept by @QuantNomad: (search "UT-Bot-Strategy"
- Our version is a complete reimplementation with significant enhancements:
- Volume-weighted momentum adjustment
- Composite stop loss from multiple S/R layers
- Multi-filter confirmation system (swing, %, 2-bar, ZLSMA)
- Full integration with multi-timeframe bias table
- Visual audit trail with freeze-on-touch
- NOTE: No code was copied - this is a complete reimplementation with enhancements.
• Standard Technical Indicators (Public Domain Formulas):
- Supertrend: ATR-based trend calculation with custom gradient fills
- MACD: Gerald Appel's formula with separation filters
- RSI: J. Welles Wilder's formula with pullback zone logic
- ADX/DMI: Custom trend strength formula inspired by Wilder's directional movement concept, reimplemented with volume weighting and efficiency metrics
- ZLSMA: Zero-lag formula enhanced with Hull MA and momentum prediction
### Custom Implementations
- Trend Strength: Inspired by Wilder's ADX concept but using volume-weighted pressure calculation and efficiency metrics (not traditional +DI/-DI smoothing)
- All code implementations are original
### ORIGINAL FEATURES (70%+ of codebase)
- Multi-Timeframe Bias Table with live updates
- Risk Management System (R-multiple TPs, freeze-on-touch)
- Opening Range Breakout tracker with session management
- Composite Stop Loss calculator using 6+ S/R layers
- Performance optimization system (caching, conditional calcs)
- VIX Fear Index integration
- Previous Day High/Low auto-detection
- Candlestick pattern recognition with interactive tooltips
- Smart label and visual management
- All UI/UX design and table architecture
### DEVELOPMENT PROCESS
**AI Assistance:** This indicator was developed over 2+ months with AI assistance (ChatGPT/Claude) used for:
- Writing Pine Script code based on design specifications
- Optimizing performance and fixing bugs
- Ensuring Pine Script v6 compliance
- Generating documentation
**Author's Role:** All trading concepts, system design, feature selection, integration logic, and strategic decisions are original work by the author. The AI was a coding tool, not the system designer.
**Transparency:** We believe in full disclosure - this project demonstrates how AI can be used as a powerful development tool while maintaining creative and strategic ownership.
---
1. WHY THIS INDICATOR IS DIFFERENT
Most traders use multiple separate indicators on their charts, leading to cluttered screens, conflicting signals, and analysis paralysis. The Suite solves this by integrating proven technical tools into a single, cohesive system.
Key Advantages:
All-in-One Design: Instead of loading 5-10 separate indicators, you get everything in one optimized script. This reduces chart clutter and improves TradingView performance.
Multi-Timeframe Bias Table: Unlike standard indicators that only show the current timeframe, the Bias Table aggregates trend signals across multiple timeframes simultaneously. See at a glance whether 1m, 5m, 15m, 1h are aligned bullish or bearish - no more switching between charts.
Smart Confirmations: The indicator doesn't just give signals - it shows you WHY. Every entry has multiple layers of confirmation (MA cross, MACD momentum, ADX strength, RSI pullback, volume, etc.) that you can toggle on/off.
Dynamic Stop Loss System: Instead of static ATR stops, the SL is calculated from multiple support/resistance layers: UT trailing line, Supertrend, VWAP, swing structure, and MA levels. This creates more intelligent, price-action-aware stops.
R-Multiple Take Profits: Built-in TP system calculates targets based on your initial risk (1R, 1.5R, 2R, 3R). Lines freeze when touched with visual checkmarks, giving you a clean audit trail of partial exits.
Educational Tooltips Everywhere: Every single input has detailed tooltips explaining what it does, typical values, and how it impacts trading. You're not guessing - you're learning as you configure.
Performance Optimized: Smart caching, conditional calculations, and modular design mean the indicator runs fast despite having 15+ features. Turn off what you don't use for even better performance.
No Repainting: All signals respect bar close. Alerts fire correctly. What you see in history is what you would have gotten in real-time.
What Makes It Unique:
Integrated UT Bot + Bias Table: No other indicator combines UT Bot's ATR trailing system with a live multi-timeframe dashboard. You get precision entries with macro trend context.
Candlestick Pattern Recognition with Interactive Tooltips: Patterns aren't just marked - hover over any emoji for a full explanation of what the pattern means and how to trade it.
Opening Range Breakout Tracker: Built-in ORB system for intraday traders with customizable session times and real-time status updates in the Bias Table.
Previous Day High/Low Auto-Detection: Automatically plots PDH/PDL on intraday charts with theme-aware colors. Updates daily without manual input.
Dynamic Row Labels in Bias Table: The table shows your actual settings (e.g., "EMA 10 > SMA 20") not generic labels. You know exactly what's being evaluated.
Modular Filter System: Instead of forcing a fixed methodology, the indicator lets you build your own strategy. Start with just UT Bot, add filters one at a time, test what works for your style.
---
2. WHO WHOULD USE THIS
Designed For:
Intermediate to Advanced Traders: You understand basic technical analysis (MAs, RSI, MACD) and want to combine multiple confirmations efficiently. This isn't a "one-click profit" system - it's a professional toolkit.
Multi-Timeframe Traders: If you trade one asset but check multiple timeframes for confirmation (e.g., enter on 5m after checking 15m and 1h alignment), the Bias Table will save you hours every week.
Trend Followers: The indicator excels at identifying and following trends using UT Bot, Supertrend, and MA systems. If you trade breakouts and pullbacks in trending markets, this is built for you.
Intraday and Swing Traders: Works equally well on 5m-1h charts (day trading) and 4h-D charts (swing trading). Scalpers can use it too with appropriate settings adjustments.
Discretionary Traders: This isn't a black-box system. You see all the components, understand the logic, and make final decisions. Perfect for traders who want tools, not automation.
Works Across All Markets:
Stocks (US, international)
Cryptocurrency (24/7 markets supported)
Forex pairs
Indices (SPY, QQQ, etc.)
Commodities
NOT Ideal For :
Complete Beginners: If you don't know what a moving average or RSI is, start with basics first. This indicator assumes foundational knowledge.
Algo Traders Seeking Black Box: This is discretionary. Signals require context and confirmation. Not suitable for blind automated execution.
Mean-Reversion Only Traders: The indicator is trend-following at its core. While VWAP bands support mean-reversion, the primary methodology is trend continuation.
---
3. CORE COMPONENTS OVERVIEW
The indicator combines these proven systems:
Trend Analysis:
Moving Averages: Four customizable MAs (Fast, Medium, Medium-Long, Long) with six types to choose from (EMA, SMA, WMA, VWMA, RMA, HMA). Mix and match for your style.
Supertrend: ATR-based trend indicator with unique gradient fill showing trend strength. One-sided ribbon visualization makes it easier to see momentum building or fading.
ZLSMA : Zero-lag linear-regression smoothed moving average. Reduces lag compared to traditional MAs while maintaining smooth curves.
Momentum & Filters:
MACD: Standard MACD with separation filter to avoid weak crossovers.
RSI: Pullback zone detection - only enter longs when RSI is in your defined "buy zone" and shorts in "sell zone".
ADX/DMI: Trend strength measurement with directional filter. Ensures you only trade when there's actual momentum.
Volume Filter: Relative volume confirmation - require above-average volume for entries.
Donchian Breakout: Optional channel breakout requirement.
Signal Systems:
UT Bot: The primary signal generator. ATR trailing stop that adapts to volatility and gives clear entry/exit points.
Base Signals: MA cross system with all the above filters applied. More conservative than UT Bot alone.
Market Bias Table: Multi-timeframe dashboard showing trend alignment across 7 timeframes plus macro bias (3-day, weekly, monthly, quarterly, VIX).
Candlestick Patterns: Six major reversal patterns auto-detected with interactive tooltips.
ORB Tracker: Opening range high/low with breakout status (intraday only).
PDH/PDL: Previous day levels plotted automatically on intraday charts.
VWAP + Bands : Session-anchored VWAP with up to three standard deviation band pairs.
---
4. THE UT BOT TRADING SYSTEM
The UT Bot is the heart of the indicator's signal generation. It's an advanced ATR trailing stop that adapts to market volatility.
Why UT Bot is Superior to Fixed Stops:
Traditional ATR stops use a fixed multiplier (e.g., "stop = entry - 2×ATR"). UT Bot is smarter:
It TRAILS the stop as price moves in your favor
It WIDENS during high volatility to avoid premature stops
It TIGHTENS during consolidation to lock in profits
It FLIPS when price breaks the trailing line, signaling reversals
Visual Elements You'll See:
Orange Trailing Line: The actual UT stop level that adapts bar-by-bar
Buy/Sell Labels: Aqua triangle (long) or orange triangle (short) when the line flips
ENTRY Line: Horizontal line at your entry price (optional, can be turned off)
Suggested Stop Loss: A composite SL calculated from multiple support/resistance layers:
- UT trailing line
- Supertrend level
- VWAP
- Swing structure (recent lows/highs)
- Long-term MA (200)
- ATR-based floor
Take Profit Lines: TP1, TP1.5, TP2, TP3 based on R-multiples. When price touches a TP, it's marked with a checkmark and the line freezes for audit trail purposes.
Status Messages: "SL Touched ❌" or "SL Frozen" when the trade leg completes.
How UT Bot Differs from Other ATR Systems:
Multiple Filters Available: You can require 2-bar confirmation, minimum % price change, swing structure alignment, or ZLSMA directional filter. Most UT implementations have none of these.
Smart SL Calculation: Instead of just using the UT line as your stop, the indicator suggests a better SL based on actual support/resistance. This prevents getting stopped out by wicks while keeping risk controlled.
Visual Audit Trail: All SL/TP lines freeze when touched with clear markers. You can review your trades weeks later and see exactly where entries, stops, and targets were.
Performance Options: "Draw UT visuals only on bar close" lets you reduce rendering load without affecting logic or alerts - critical for slower machines or 1m charts.
Trading Logic:
UT Bot flips direction (Buy or Sell signal appears)
Check Bias Table for multi-timeframe confirmation
Optional: Wait for Base signal or candlestick pattern
Enter at signal bar close or next bar open
Place stop at "Suggested Stop Loss" line
Scale out at TP levels (TP1, TP2, TP3)
Exit remaining position on opposite UT signal or stop hit
---
5. UNDERSTANDING THE MARKET BIAS TABLE
This is the indicator's unique multi-timeframe intelligence layer. Instead of looking at one chart at a time, the table aggregates signals across seven timeframes plus macro trend bias.
Why Multi-Timeframe Analysis Matters:
Professional traders check higher and lower timeframes for context:
Is the 1h uptrend aligning with my 5m entry?
Are all short-term timeframes bullish or just one?
Is the daily trend supportive or fighting me?
Doing this manually means opening multiple charts, checking each indicator, and making mental notes. The Bias Table does it automatically in one glance.
Table Structure:
Header Row:
On intraday charts: 1m, 5m, 15m, 30m, 1h, 2h, 4h (toggle which ones you want)
On daily+ charts: D, W, M (automatic)
Green dot next to title = live updating
Headline Rows - Macro Bias:
These show broad market direction over longer periods:
3 Day Bias: Trend over last 3 trading sessions (uses 1h data)
Weekly Bias: Trend over last 5 trading sessions (uses 4h data)
Monthly Bias: Trend over last 30 daily bars
Quarterly Bias: Trend over last 13 weekly bars
VIX Fear Index: Market regime based on VIX level - bullish when low, bearish when high
Opening Range Breakout: Status of price vs. session open range (intraday only)
These rows show text: "BULLISH", "BEARISH", or "NEUTRAL"
Indicator Rows - Technical Signals:
These evaluate your configured indicators across all active timeframes:
Fast MA > Medium MA (shows your actual MA settings, e.g., "EMA 10 > SMA 20")
Price > Long MA (e.g., "Price > SMA 200")
Price > VWAP
MACD > Signal
Supertrend (up/down/neutral)
ZLSMA Rising
RSI In Zone
ADX ≥ Minimum
These rows show emojis: GREEB (bullish), RED (bearish), GRAY/YELLOW (neutral/NA)
AVG Column:
Shows percentage of active timeframes that are bullish for that row. This is the KEY metric:
AVG > 70% = strong multi-timeframe bullish alignment
AVG 40-60% = mixed/choppy, no clear trend
AVG < 30% = strong multi-timeframe bearish alignment
How to Use the Table:
For a long trade:
Check AVG column - want to see > 60% ideally
Check headline bias rows - want to see BULLISH, not BEARISH
Check VIX row - bullish market regime preferred
Check ORB row (intraday) - want ABOVE for longs
Scan indicator rows - more green = better confirmation
For a short trade:
Check AVG column - want to see < 40% ideally
Check headline bias rows - want to see BEARISH, not BULLISH
Check VIX row - bearish market regime preferred
Check ORB row (intraday) - want BELOW for shorts
Scan indicator rows - more red = better confirmation
When AVG is 40-60%:
Market is choppy, mixed signals. Either stay out or reduce position size significantly. These are low-probability environments.
Unique Features:
Dynamic Labels: Row names show your actual settings (e.g., "EMA 10 > SMA 20" not generic "Fast > Slow"). You know exactly what's being evaluated.
Customizable Rows: Turn off rows you don't care about. Only show what matters to your strategy.
Customizable Timeframes: On intraday charts, disable 1m or 4h if you don't trade them. Reduces calculation load by 20-40%.
Automatic HTF Handling: On Daily/Weekly/Monthly charts, the table automatically switches to D/W/M columns. No configuration needed.
Performance Smart: "Hide BIAS table on 1D or above" option completely skips all table calculations on higher timeframes if you only trade intraday.
---
6. CANDLESTICK PATTERN RECOGNITION
The indicator automatically detects six major reversal patterns and marks them with emojis at the relevant bars.
Why These Six Patterns:
These are the most statistically significant reversal patterns according to trading literature:
High win rate when appearing at support/resistance
Clear visual structure (not subjective)
Work across all timeframes and assets
Studied extensively by institutions
The Patterns:
Bullish Patterns (appear at bottoms):
Bullish Engulfing: Green candle completely engulfs prior red candle's body. Strong reversal signal.
Hammer: Small body with long lower wick (at least 2× body size). Shows rejection of lower prices by buyers.
Morning Star: Three-candle pattern (large red → small indecision → large green). Very strong bottom reversal.
Bearish Patterns (appear at tops):
Bearish Engulfing: Red candle completely engulfs prior green candle's body. Strong reversal signal.
Shooting Star: Small body with long upper wick (at least 2× body size). Shows rejection of higher prices by sellers.
Evening Star: Three-candle pattern (large green → small indecision → large red). Very strong top reversal.
Interactive Tooltips:
Unlike most pattern indicators that just draw shapes, this one is educational:
Hover your mouse over any pattern emoji
A tooltip appears explaining: what the pattern is, what it means, when it's most reliable, and how to trade it
No need to memorize - learn as you trade
Noise Filter:
"Min candle body % to filter noise" setting prevents false signals:
Patterns require minimum body size relative to price
Filters out tiny candles that don't represent real buying/selling pressure
Adjust based on asset volatility (higher % for crypto, lower for low-volatility stocks)
How to Trade Patterns:
Patterns are NOT standalone entry signals. Use them as:
Confirmation: UT Bot gives signal + pattern appears = stronger entry
Reversal Warning: In a trade, opposite pattern appears = consider tightening stop or taking profit
Support/Resistance Validation: Pattern at key level (PDH, VWAP, MA 200) = level is being respected
Best combined with:
UT Bot or Base signal in same direction
Bias Table alignment (AVG > 60% or < 40%)
Appearance at obvious support/resistance
---
7. VISUAL TOOLS AND FEATURES
VWAP (Volume Weighted Average Price):
Session-anchored VWAP with standard deviation bands. Shows institutional "fair value" for the trading session.
Anchor Options: Session, Day, Week, Month, Quarter, Year. Choose based on your trading timeframe.
Bands: Up to three pairs (X1, X2, X3) showing statistical deviation. Price at outer bands often reverses.
Auto-Hide on HTF: VWAP hides on Daily/Weekly/Monthly charts automatically unless you enable anchored mode.
Use VWAP as:
Directional bias (above = bullish, below = bearish)
Mean reversion levels (outer bands)
Support/resistance (the VWAP line itself)
Previous Day High/Low:
Automatically plots yesterday's high and low on intraday charts:
Updates at start of each new trading day
Theme-aware colors (dark text for light charts, light text for dark charts)
Hidden automatically on Daily/Weekly/Monthly charts
These levels are critical for intraday traders - institutions watch them closely as support/resistance.
Opening Range Breakout (ORB):
Tracks the high/low of the first 5, 15, 30, or 60 minutes of the trading session:
Customizable session times (preset for NYSE, LSE, TSE, or custom)
Shows current breakout status in Bias Table row (ABOVE, BELOW, INSIDE, BUILDING)
Intraday only - auto-disabled on Daily+ charts
ORB is a classic day trading strategy - breakout above opening range often leads to continuation.
Extra Labels:
Change from Open %: Shows how far price has moved from session open (intraday) or daily open (HTF). Green if positive, red if negative.
ADX Badge: Small label at bottom of last bar showing current ADX value. Green when above your minimum threshold, red when below.
RSI Badge: Small label at top of last bar showing current RSI value with zone status (buy zone, sell zone, or neutral).
These labels provide quick at-a-glance confirmation without needing separate indicator windows.
---
8. HOW TO USE THE INDICATOR
Step 1: Add to Chart
Load the indicator on your chosen asset and timeframe
First time: Everything is enabled by default - the chart will look busy
Don't panic - you'll turn off what you don't need
Step 2: Start Simple
Turn OFF everything except:
UT Bot labels (keep these ON)
Bias Table (keep this ON)
Moving Averages (Fast and Medium only)
Suggested Stop Loss and Take Profits
Hide everything else initially. Get comfortable with the basic UT Bot + Bias Table workflow first.
Step 3: Learn the Core Workflow
UT Bot gives a Buy or Sell signal
Check Bias Table AVG column - do you have multi-timeframe alignment?
If yes, enter the trade
Place stop at Suggested Stop Loss line
Scale out at TP levels
Exit on opposite UT signal
Trade this simple system for a week. Get a feel for signal frequency and win rate with your settings.
Step 4: Add Filters Gradually
If you're getting too many losing signals (whipsaws in choppy markets), add filters one at a time:
Try: "Require 2-Bar Trend Confirmation" - wait for 2 bars to confirm direction
Try: ADX filter with minimum threshold - only trade when trend strength is sufficient
Try: RSI pullback filter - only enter on pullbacks, not chasing
Try: Volume filter - require above-average volume
Add one filter, test for a week, evaluate. Repeat.
Step 5: Enable Advanced Features (Optional)
Once you're profitable with the core system, add:
Supertrend for additional trend confirmation
Candlestick patterns for reversal warnings
VWAP for institutional anchor reference
ORB for intraday breakout context
ZLSMA for low-lag trend following
Step 6: Optimize Settings
Every setting has a detailed tooltip explaining what it does and typical values. Hover over any input to read:
What the parameter controls
How it impacts trading
Suggested ranges for scalping, day trading, and swing trading
Start with defaults, then adjust based on your results and style.
Step 7: Set Up Alerts
Right-click chart → Add Alert → Condition: "Luxy Momentum v6" → Choose:
"UT Bot — Buy" for long entries
"UT Bot — Sell" for short entries
"Base Long/Short" for filtered MA cross signals
Optionally enable "Send real-time alert() on UT flip" in settings for immediate notifications.
Common Workflow Variations:
Conservative Trader:
UT signal + Base signal + Candlestick pattern + Bias AVG > 70%
Enter only at major support/resistance
Wider UT sensitivity, multiple filters
Aggressive Trader:
UT signal + Bias AVG > 60%
Enter immediately, no waiting
Tighter UT sensitivity, minimal filters
Swing Trader:
Focus on Daily/Weekly Bias alignment
Ignore intraday noise
Use ORB and PDH/PDL less (or not at all)
Wider stops, patient approach
---
9. PERFORMANCE AND OPTIMIZATION
The indicator is optimized for speed, but with 15+ features running simultaneously, chart load time can add up. Here's how to keep it fast:
Biggest Performance Gains:
Disable Unused Timeframes: In "Time Frames" settings, turn OFF any timeframe you don't actively trade. Each disabled TF saves 10-15% calculation time. If you only day trade 5m, 15m, 1h, disable 1m, 2h, 4h.
Hide Bias Table on Daily+: If you only trade intraday, enable "Hide BIAS table on 1D or above". This skips ALL table calculations on higher timeframes.
Draw UT Visuals Only on Bar Close: Reduces intrabar rendering of SL/TP/Entry lines. Has ZERO impact on logic or alerts - purely visual optimization.
Additional Optimizations:
Turn off VWAP bands if you don't use them
Disable candlestick patterns if you don't trade them
Turn off Supertrend fill if you find it distracting (keep the line)
Reduce "Limit to 10 bars" for SL/TP lines to minimize line objects
Performance Features Built-In:
Smart Caching: Higher timeframe data (3-day bias, weekly bias, etc.) updates once per day, not every bar
Conditional Calculations: Volume filter only calculates when enabled. Swing filter only runs when enabled. Nothing computes if turned off.
Modular Design: Every component is independent. Turn off what you don't need without breaking other features.
Typical Load Times:
5m chart, all features ON, 7 timeframes: ~2-3 seconds
5m chart, core features only, 3 timeframes: ~1 second
1m chart, all features: ~4-5 seconds (many bars to calculate)
If loading takes longer, you likely have too many indicators on the chart total (not just this one).
---
10. FAQ
Q: How is this different from standard UT Bot indicators?
A: Standard UT Bot (originally by @QuantNomad) is just the ATR trailing line and flip signals. This implementation adds:
- Volume weighting and momentum adjustment to the trailing calculation
- Multiple confirmation filters (swing, %, 2-bar, ZLSMA)
- Smart composite stop loss system from multiple S/R layers
- R-multiple take profit system with freeze-on-touch
- Integration with multi-timeframe Bias Table
- Visual audit trail with checkmarks
Q: Can I use this for automated trading?
A: The indicator is designed for discretionary trading. While it has clear signals and alerts, it's not a mechanical system. Context and judgment are required.
Q: Does it repaint?
A: No. All signals respect bar close. UT Bot logic runs intrabar but signals only trigger on confirmed bars. Alerts fire correctly with no lookahead.
Q: Do I need to use all the features?
A: Absolutely not. The indicator is modular. Many profitable traders use just UT Bot + Bias Table + Moving Averages. Start simple, add complexity only if needed.
Q: How do I know which settings to use?
A: Every single input has a detailed tooltip. Hover over any setting to see:
What it does
How it affects trading
Typical values for scalping, day trading, swing trading
Start with defaults, adjust gradually based on results.
Q: Can I use this on crypto 24/7 markets?
A: Yes. ORB will not work (no defined session), but everything else functions normally. Use "Day" anchor for VWAP instead of "Session".
Q: The Bias Table is blank or not showing.
A: Check:
"Show Table" is ON
Table position isn't overlapping another indicator's table (change position)
At least one row is enabled
"Hide BIAS table on 1D or above" is OFF (if on Daily+ chart)
Q: Why are candlestick patterns not appearing?
A: Patterns are relatively rare by design - they only appear at genuine reversal points. Check:
Pattern toggles are ON
"Min candle body %" isn't too high (try 0.05-0.10)
You're looking at a chart with actual reversals (not strong trending market)
Q: UT Bot is too sensitive/not sensitive enough.
A: Adjust "Sensitivity (Key×ATR)". Lower number = tighter stop, more signals. Higher number = wider stop, fewer signals. Read the tooltip for guidance.
Q: Can I get alerts for the Bias Table?
A: The Bias Table is a dashboard for visual analysis, not a signal generator. Set alerts on UT Bot or Base signals, then manually check Bias Table for confirmation.
Q: Does this work on stocks with low volume?
A: Yes, but turn OFF the volume filter. Low volume stocks will never meet relative volume requirements.
Q: How often should I check the Bias Table?
A: Before every entry. It takes 2 seconds to glance at the AVG column and headline rows. This one check can save you from fighting the trend.
Q: What if UT signal and Base signal disagree?
A: UT Bot is more aggressive (ATR trailing). Base signals are more conservative (MA cross + filters). If they disagree, either:
Wait for both to align (safest)
Take the UT signal but with smaller size (aggressive)
Skip the trade (conservative)
There's no "right" answer - depends on your risk tolerance.
---
FINAL NOTES
The indicator gives you an edge. How you use that edge determines results.
For questions, feedback, or support, comment on the indicator page or message the author.
Happy Trading!

Koncorde Crossing Screener (UP/DOWN) AlertThis indicators works on Koncorde Crossing Pattern, generating alerts when Cross is Up (buy) and Down (sell).

Scalp Recent High/Low (Stable v5 r4)UMA Scalp Levels(ウマ・スキャル・レベルズ)
UMA Scalp Levels
Automatically detects recent swing highs and lows —
the “psychological levels” most watched by traders —
and alerts you when a valid breakout occurs.
🔹 Detects swing highs/lows automatically (non-repainting)
🔹 Confirm breakouts by close or wick (configurable)
🔹 Filters small fakeouts using ATR / % thresholds
🔹 Supports breakout alerts (up / down / retest)
🔹 MTF compatible — e.g., show 15m levels on 5m chart
Ideal for scalpers and day traders who want to catch momentum
immediately after a breakout of key levels.
直近で“市場が意識している高値・安値ライン”を自動で検出し、
ブレイク時にサインとアラートを出す、順張り型のスキャルピング指標。
🔹 スイング高値・安値を自動抽出(リペイント耐性あり)
🔹 終値 or ヒゲ抜けでブレイク判定(選択可能)
🔹 ATRや%幅でノイズを除外(小さな抜けをフィルタリング)
🔹 アラート対応(上抜け/下抜け/リテスト検知)
🔹 MTF対応(例:15分足ラインを5分足チャートに表示)
短期トレードで最も意識される「節目の抜け」を視覚化し、
勢いに乗る順張りトレードの精度を高めます。

Long-Term Capitulation Oscillator (LTCO, Diodato 2019)Description:
This script is a faithful implementation of the Long-Term Capitulation Oscillator (LTCO) from Chris Diodato's award-winning 2019 CMT paper, "Making The Most Of Panic". It is a strategic, market-wide breadth and volume oscillator designed to identify major, long-term market bottoms.
What It Is
The LTCO combines long-term moving averages (34, 55, 89, 144, and 233-day) of NYSE advancing/declining issues and up/down volume. It uses a unique "average of averages" method to create a responsive yet strategic long-term indicator. This script plots the raw, un-normalized value as described in the paper, which typically oscillates in the 700-1100 range.
How to Interpret
The LTCO is a strategic tool for identifying potentially significant market turning points.
Extremely Low Readings: Suggest that a long-term period of selling has reached a point of exhaustion, potentially marking a major bear market low or a generational buying opportunity. The paper backtested various thresholds, with values below 950, 925, and especially 875 showing historically strong forward returns over the next 6-24 months.
Overbought/Oversold Lines: The script includes customizable overbought/oversold lines to help you visually identify these critical zones.
Settings
Data Sources: Allows toggling the use of "Unchanged" issues/volume data for the calculation.
Thresholds: You can set the overbought and oversold levels to your preference, based on the paper's findings or your own research.

漲跌偏見 (Only Daily)Indicator purpose (simple):
Draws previous day’s High/Low on the chart (daily only).
Checks yesterday’s candle outcome (up or down) relative to the prior day’s High/Low.
If yesterday’s move extended (e.g., close above prior High or below prior Low), it keeps that bias for today.
If yesterday’s move was invalidated (e.g., close reclaimed back inside), it flips the bias for today.
Plots today’s target:
Bull bias → yesterday’s High
Bear bias → yesterday’s Low
Shows only one line/label for the current day.
Not color-dependent (uses close vs. open to detect up/down).

Market GoatFuel v1Market GoatFuel is an all-in-one trading tool designed to provide a clear, confluence-based view of the market. Its primary goal is to filter out the noise typical of lower timeframes and present only high-probability momentum signals. By layering multiple validation criteria, it ensures that a trade signal is only generated when the trend, momentum, and volume are in alignment.
Key Features
Multi-Layered Trend Analysis: Utilizes a customizable MA Cloud and a Higher-Timeframe (HTF) EMA to establish the dominant trend direction. Trades are only considered in alignment with this trend.
Dual RSI Momentum Engine: A fast RSI (default 9) detects the initial burst of momentum, while a slower RSI (default 21) confirms its sustainability. This dual-check prevents entries on weak or temporary moves.
Advanced Signal Filtering: A signal is only confirmed if the momentum conditions are met for two consecutive bars, effectively filtering out false signals from single-bar spikes.
Higher Timeframe Confluence: In addition to the HTF EMA, the script also checks that the RSI on the higher timeframe is aligned with the trade direction, ensuring you are trading with the dominant momentum.
Volume Validation: Every signal is cross-referenced with volume. A signal is only considered valid if volume is above its moving average, confirming there is conviction behind the price action.
Clean & Customizable Visuals: Features clean up/down arrows for trade signals, with optional background coloring and volume-based bar coloring to provide a full market snapshot at a glance.

Futures Day Trading Key Levels by Dhawal Ranka
Hey everyone, thank you for using this script, let me know in the comments how you feel about it!
What this script does:
This indicator renders one consolidated map of intraday reference levels for futures (e.g., ES, NQ, GC, CL). It is session-aware and draws:
- Previous ETH day High/Low/Close
- Previous RTH High/Low/Close (built from your RTH session)
- Today’s developing RTH High/Low and Mid
- Overnight (ON) session High/Low
- Opening Range (first N minutes of RTH): OR High/Low
- VWAP (day-anchored) with optional ±σ bands
- Floor Pivots (PP/R1/S1/R2/S2) from prior ETH daily bar
- ADR projections (Up/Down) using a configurable lookback and anchor
- Settlement: prior official settlement and today’s projected settle (with manual override)
- Weekly/Monthly context: prior W/M High/Low/Close and current W/M Open
- Minimal right-edge text tags (instead of big boxes) that sit on the price scale line and auto-pack when levels coincide
All lines extend across the chart to make confluence obvious without clutter.
How it works (methods & calculations)
Sessions
The script exposes two user sessions and a time zone:
RTH (e.g., 09:30–16:00 America/New_York)
ON (e.g., 18:00–09:29 America/New_York)
Session membership is computed with time(timeframe, session, tz) != 0.
RTH H/L/C (prev) are aggregated intrabar: on RTH start we seed H/L; while inRTH we update; on RTH end we store the close.
Previous Day (ETH) levels
request.security(syminfo.tickerid, "D", high /low /close ) supplies PDH/PDL/PDC on the continuous ETH daily.
Opening Range
On RTH start we mark orStartTime.
While RTH is active and elapsed time < N minutes, we track the running high/low.
When elapsed ≥ N minutes, we freeze OR High/Low.
VWAP & ±σ bands (intraday)
Day-anchored VWAP uses ta.vwap(hlc3).
Bands: standard deviation of (close − vwap) from day start, accumulated inline:
stdev = sqrt( mean(dev^2) − mean(dev)^2 )
Bands = vwap ± k * stdev (user multiplier).
Floor Pivots (classic)
Using prior ETH daily H/L/C:
PP = (H + L + C) / 3
R1 = 2*PP − L, S1 = 2*PP − H
R2 = PP + (H − L), S2 = PP − (H − L).
ADR projections
Daily range series rng = request.security(..., "D", high - low).
ADR = SMA(rng, L) (default L=14).
Anchor is user-selectable: today’s open or yesterday’s close.
Projections: ADR Up = anchor + ADR/2, ADR Down = anchor − ADR/2.
Settlement
Prev Settle defaults to prior ETH daily close but can be overridden manually for markets where official settlement differs from feed close.
Today Projected Settle uses the current ETH daily close value.
Weekly / Monthly context
Prior W/M H/L/C from "W"/"M" with , plus current W/M Open.
Rendering & label logic (originality)
Lines are persistent: each named level owns one line object that is updated, not re-created—keeps resource use low and avoids “too many plots”.
Right-edge labels are text-only (no box) placed at x = bar_index + offset and yloc.price.
When multiple levels share (almost) the same price, labels are packed side-by-side using a small bucketing algorithm:
Prices are bucketed within ±½ tick.
Each label gets a position index inside its bucket; the final x-offset = baseOffset + index*step + priority.
Priorities nudge important tags (e.g., Settle/RTH levels) closer to the price scale so they remain readable.
Why this is published & what’s original
It’s not a simple mashup: the script’s utility is the session-aware aggregation, the OR timing logic, the intraday σ calculation around VWAP, the line-persistence manager, and the label packing with priorities that keeps the right edge readable even when many levels coincide.
The closed-source protection covers the packing/priority scheme and the persistent object management that make it practical on busy futures charts without hitting Pine limits.
How to use
Set your sessions & time zone
Choose RTH/ON session windows (the defaults match CME equity index futures) and the time zone of your charting workflow.
Toggle components
Enable only the layers you need (e.g., VWAP bands off if you want a cleaner chart).
Opening Range length (minutes) is adjustable.
Settlement
If your broker/feed’s daily close isn’t the official settlement, enter a manual settle value for the prior day.
Read the right edge
Labels sit on the price scale line. When two labels share the same price, they appear side-by-side rather than overlapping.
Timeframes & symbols
Designed for intraday futures on 1–30m. Works on other symbols/timeframes but intent is day trading.
Inputs (summary)
Sessions/TZ: RTH window, ON window, time zone
Today: RTH H/L/Mid, ON H/L, OR (minutes)
VWAP: on/off, ±σ bands, multiplier
Pivots: PP/R1/S1/R2/S2 (ETH)
ADR: lookback, anchor (open vs. prev close)
Settlement: show prev/proj, manual override
Weekly/Monthly: prior H/L/C + current open
Style: line transparency; right-edge tag size, base offset, and step; optional inline labels
Limitations & notes
“Prev Settle” equals the prior daily close unless overridden.
Session definitions matter: if your exchange hours differ, set your own RTH/ON windows.
No alerts are included to minimize plot count and keep performance high (you can add alert conditions on any level in a private copy).
Disclaimer
For educational purposes only; not financial advice. Futures trading involves significant risk.
Versioning
This script will be maintained under a single publication using Update (no minor forks). Major changes will be documented in the Change Log section of the script description.

Market Structure (BOS on Break, HH/HL/LH/LL)Market Structure (BOS on Break, HH/HL/LH/LL) is a clean and reactive market structure tool designed for traders who want clear visual feedback of trend direction and structure changes.
It automatically identifies:
Higher Highs (HH)
Higher Lows (HL)
Lower Highs (LH)
Lower Lows (LL)
Breaks of Structure (BOS) when price breaches previous swing levels.
✳️ Features
Automatic Structure Detection: Detects swing highs/lows based on your left/right pivot settings.
Break of Structure Alerts: Instantly updates bias when price breaks a previous swing level (no delay).
Real-Time BOS Response: Structure flips as soon as price takes out the previous high or low.
Color-Coded Bars: Bars can auto-paint white for bullish and black for bearish conditions.
Optional Fading Dots: Visual fading dots track trend duration and strength for quick bias reading.
Customizable Pivots: Choose how many bars to use for left/right swing confirmation.
Alerts: Fully configured for HH, HL, LH, LL, BOS Up, and BOS Down events.
⚙️ Inputs
Left Pivot Bars / Right Pivot Bars: Control how many candles define a valid swing point.
Paint Bars by Trend: Toggle bar coloring to match bullish or bearish bias.
Show Fading Trend Dots: Add fading dots that shrink and fade as a trend matures.
🔔 Alerts
Break of Structure Up / Down
Higher High (HH) confirmed
Higher Low (HL) confirmed
Lower High (LH) confirmed
Lower Low (LL) confirmed
🎯 Use Case
Perfect for:
Price action traders
Smart money concept (SMC) practitioners
Trend structure analysts
Scalpers and swing traders looking for quick structure flips.
🧠 Notes
Works on any timeframe and any instrument.
BOS signals update immediately when price breaks structure (no lag).
For additional BOS markers, you can uncomment the last few lines in the script to show arrows when structure breaks.

TGFA Flexible Alerts Multi-MA CrossoversTGFA Flexible Alerts, Multi-MA Crossovers
Description
Flexible MA crossovers with BUY/SELL alerts, customizable candle colors, and an info box for ATR/volatility insights. Supports EMA/SMA/HMA/VWAP on any chart.
Overview
TGFA Flexible Alerts is a versatile Pine Script indicator for traders seeking customizable moving average (MA) crossovers, visual signals, and quick-reference metrics. It overlays crossover lines (e.g., fast EMA over slow SMA), generates BUY/SELL labels and alerts, colors candles based on themes, and includes an optional info box with ATR bands, support/resistance, and trend projections. Built for any symbol and timeframe (optimized for 1H intraday), it auto-detects Heikin Ashi charts and handles mixed MA types like responsive HMA with lagging EMAs. All logic uses built-in TA functions for reliability—no repainting on confirmed bars.
Key Features
MA Crossover Engine: Configurable lines (EMA, SMA, HMA, VWAP) with dynamic colors (HMA tints green/red based on slope). Enable/disable via inputs.
Invert Signals Toggle: Flips BUY/SELL logic for mixed MA setups (e.g., HMA as fast line over EMA).
Reasoning: Traditional crossovers assume a fast line (low lag) crossing above a slow line (high lag) for buys. HMA's hull design makes it ultra-responsive, so it may "lead" too aggressively—causing premature signals. Inverting aligns it with user intuition (e.g., HMA dipping below then recovering signals strength), reducing false positives in trending markets. Test on your pairs!
Visual Alerts: BUY/SELL labels at crossover price (with optional price display and offset adjustment).
Single MA Overlays: Independent plots for EMA/SMA/HMA/VWAP (length 0 to hide).
Info Box: Real-time table with current price, ±1/2 ATR bands, median price (over lookback), trend (SMA50 slope), volatility % (ATR normalized), support/resistance (recent highs/lows), and reversal projections (tied to SMA50 pivot for up/down bias).
Candle Coloring: 20+ themes (dark/light canvases) for bull/bear/reversal/low-volume bars—e.g., Emerald Blaze greens uptrends, dims on low vol. Toggle off for no changes.
Chart Source Flexibility: Auto-switches to Heikin Ashi if detected; manual override for Regular/HA.
Alerts fire on crossovers/crossunders (custom messages with ticker/interval). Open-source for forking.
How to Use
Add to Chart: Search in TradingView's public library, apply to any symbol (e.g., stocks, forex). Best on 1H for intraday, but works on daily/weekly too.
Setup Crossovers: Choose Line 1/2 types/lengths (e.g., HMA 9 over SMA 20). Enable "Invert Signals" if using HMA—prevents lag mismatches in volatile assets.
Alerts & Labels: Toggle labels for visuals; set TradingView alerts on "Buy"/"Sell" conditions. Use offset for crowded charts.
Info Box Insights: Enable for quick scans—e.g., enter long near support if trend is bullish and price > median. Adjust ATR length (default 14) for sensitivity.
Candle Themes: Pick a scheme (e.g., Neon Pulse for dark mode); it overrides bar colors without altering data.
Customization Tip: For HMA-heavy setups, invert + short lengths (5-9) catch turns early; pair with volume filter in alerts.
Limitations & Disclaimers - Designed for overlay on price charts; may overlap in tight ranges—adjust transparency via styles.
HMA can repaint intra-bar; signals confirm on close. Not back tested for all assets—validate with strategy tester.
Info box projections use SMA(50) as a trend pivot (same for up/down as reference); customize via code for advanced calcs. Candle colors are cosmetic only.
This is an analysis tool, not advice. Trading involves risk; combine with fundamentals/news. Past performance isn't indicative of future results. No liability for losses.
I'm still a newbie, so feedback encouraged!
Thank you!!
ThisGirl

AutoDay MA (Session-Normalized)📊 AutoDay MA (Session-Normalized Moving Average)
⚡ Daily power, intraday precision.
AutoDay MA automatically converts any N-day moving average into the exact equivalent on your current intraday timeframe.
💡 Concept inspired by Brian Shannon (Alphatrends) – mapping daily MAs onto intraday charts by normalizing session minutes.
🛠 How it works
Set Days (N) (e.g., 5, 10, 20).
Define Session Minutes per Day (⏱ 390 = US RTH, 🌍 1440 = 24h).
The indicator detects your chart’s timeframe and computes:
Length = (Days × SessionMinutes) / BarMinutes
Applies your chosen MA type (📐 SMA / EMA / RMA / WMA) with rounding (nearest, up, down).
Displays all details in a clear corner info panel.
✅ Why use it
Consistency 🔄: Same 5-day smoothing across all intraday charts.
Session-aware 🕒: Works for equities, futures, FX, crypto.
Transparency 🔍: Always shows the math & final MA length.
Alerts built-in 🔔: Cross up/down vs. price.
📈 Examples
5-Day on 1m → 1950-period MA
5-Day on 15m → 130-period MA
5-Day on 65m → 30-period MA
10-Day on 24h/15m (crypto) → 960-period MA

FibPulse144 [CHE] FibPulse144 — ADX-gated 13/21 crossover with 144-trend regime and closed-bar labels
Summary
FibPulse144 combines a fast moving-average crossover with a 144-period trend regime and an ADX strength gate. Signals are confirmed on closed bars only and drawn as labels on the price chart, while an ADX line in a separate pane provides context. Color gradients are derived from normalized ADX, so visual intensity reflects trend strength without changing the underlying logic. The approach reduces false flips during weak conditions and keeps entries aligned with the dominant trend.
Motivation: Why this design?
Traditional crossover signals can flip repeatedly during sideways phases and often trigger against the higher-time regime. By requiring alignment with a slower trend proxy and by gating entries through a rising ADX condition, FibPulse144 favors structurally cleaner transitions. Gradient coloring communicates strength visually, helping users temper aggressiveness without additional indicators.
What’s different vs. standard approaches?
Baseline: Classic dual-MA crossover with unconditional signals.
Architecture differences:
Two-bar regime confirmation against a 144-period trend average.
Pending-signal logic that waits for regime and optional ADX approval.
ADX strength gate using the prior reading relative to a user threshold and earlier value.
Gradient colors scaled by an ADX window with gamma controls.
Price-chart labels enforced via overlay on an otherwise pane-based indicator.
Practical effect: Fewer signals during weak or choppy conditions, labels that appear only after a bar closes, and color intensity that mirrors trend quality.
How it works (technical)
The script computes fast and slow moving averages using the selected method and lengths. A separate 144-length average defines the regime using a two-bar confirmation above or below it. Crossovers are observed on the previous bar to avoid intrabar ambiguity; once a prior crossover is detected, it is stored as pending. A pending long requires regime alignment and, if enabled, an ADX condition based on the previous reading being above the threshold and greater than an earlier reading. The state machine holds neutral, long, or short until an exit condition or ADX reset is met. ADX is normalized within a user window, scaled with gamma, and mapped to up and down color palettes to render gradients. Labels on the price panel are forced to overlay, while the ADX line and threshold guide remain in a separate pane.
Parameter Guide
Source — Input data for all calculations. Default: close. Tip: keep consistent with your chart.
MA Type — EMA or SMA. Default: EMA. EMA reacts faster; SMA is smoother.
Fast / Slow — Fast and slow lengths for crossover. Defaults: 13 and 21. Shorter reacts earlier; longer reduces noise.
Trend — Regime average length. Default: 144. Larger values stabilize regime; smaller values increase sensitivity.
Use 144 as trend filter — Enables regime gating. Default: true. Disable to allow raw crossovers.
Use ADX filter — Requires ADX strength. Default: true. Disable to allow signals regardless of strength.
ADX Len — DI and ADX smoothing length. Default: 14. Higher values smooth strength; lower values react faster.
ADX Thresh — Minimum strength for signals. Default: 25. Raise to reduce flips; lower to capture earlier moves.
Entry/Exit labels (price) — Price-panel labels on state changes. Default: true.
Signal labels in ADX pane — Small markers at the ADX value on entries. Default: true.
Label size — tiny, small, normal, large. Default: normal.
Enable barcolor — Optional candle tint by regime and gradient. Default: false.
Enable gradient — Turns on ADX-driven color blending. Default: true.
Window — Bars used to normalize ADX for colors. Default: 100; minimum: 5.
Gamma bars / Gamma plots — Nonlinear scaling for bar and line intensities. Default: 0.80; between 0.30 and 2.00.
Gradient transp (0–90) — Transparency for gradient colors. Default: 0.
MA fill transparency (0–100) — Fill opacity between fast and slow lines. Default: 65.
Palette colors (Up/Down) — Dark and neon endpoints for up and down gradients. Defaults as in the code.
Reading & Interpretation
Fast/Slow lines: When the fast line is above the slow line, the line and fill use the long palette; when below, the short palette is used.
Trend MA (144): Neutral gray line indicating the regime boundary.
Labels on price: “LONG” appears when the state turns long; “SHORT” when it turns short. Labels appear only after the bar closes and conditions are satisfied.
ADX pane: The ADX line shows current strength. The dotted threshold line is the user level for gating. Optional small markers indicate entries at the ADX value.
Bar colors (optional): Candle tint intensity reflects normalized ADX. Higher intensity implies stronger conditions.
Practical Workflows & Combinations
Trend following: Use long entries when fast crosses above slow and price has held above the trend average for two bars, with ADX above threshold. Mirror this for shorts below the trend average.
Exits and stops: Consider reducing exposure when price closes on the opposite side of the trend average for two consecutive bars or when ADX fades below the threshold if the ADX filter is enabled.
Structure confirmation: Combine with higher-timeframe structure such as swing highs and lows or a simple market structure overlay for confirmation.
Multi-asset/Multi-TF: Works across liquid assets. For lower timeframes, consider a slightly lower ADX threshold; for higher timeframes, maintain or raise the threshold to avoid unnecessary flips.
Behavior, Constraints & Performance
Repaint/confirmation: Signals are based on previous-bar crossovers and are confirmed on bar close. No higher-timeframe or security calls are used. Intrabar markers are not relied upon.
Resources: The script declares `max_bars_back` of 2000, uses no loops or arrays, and employs persistent variables for pending signals and state.
Known limits: Crossover systems can lag after sudden reversals. During tight ranges, disabling the ADX filter may increase flips; keeping it enabled may skip early transitions.
Sensible Defaults & Quick Tuning
Starting point: EMA, 13/21/144, ADX length 14, ADX threshold 25, gradients on, barcolor off.
Too many flips: Increase ADX threshold or length; increase trend length; consider SMA instead of EMA.
Too sluggish: Lower ADX threshold slightly; shorten fast and slow lengths; reduce the trend length.
Colors overpowering: Increase gradient transparency or reduce gamma values toward one.
What this indicator is—and isn’t
This is a visualization and signal layer that combines crossover, regime, and strength gating. It does not predict future movements, manage risk, or execute trades. Use it alongside clear structure, risk controls, and a defined position management plan.
Disclaimer
The content provided, including all code and materials, is strictly for educational and informational purposes only. It is not intended as, and should not be interpreted as, financial advice, a recommendation to buy or sell any financial instrument, or an offer of any financial product or service. All strategies, tools, and examples discussed are provided for illustrative purposes to demonstrate coding techniques and the functionality of Pine Script within a trading context.
Any results from strategies or tools provided are hypothetical, and past performance is not indicative of future results. Trading and investing involve high risk, including the potential loss of principal, and may not be suitable for all individuals. Before making any trading decisions, please consult with a qualified financial professional to understand the risks involved.
By using this script, you acknowledge and agree that any trading decisions are made solely at your discretion and risk.
Do not use this indicator on Heikin-Ashi, Renko, Kagi, Point-and-Figure, or Range charts, as these chart types can produce unrealistic results for signal markers and alerts.
Best regards and happy trading
Chervolino
